Over a couple of weekends a few months ago, I made a weather dashboard which you can run yourself and which stores all it’s data (optionally) on your own resources in perpetuity. It is a relatively basic from a meteorology perspective but shows a lot of data pertinent to a layman (like me). It is configurable for any latitude and longitude in the world and includes air quality measurements alongside regular weather stuff (e.g., temperature, probability of precipitation, etc.).
The dashboard
The first segment is an overview of basic current weather and abbreviated forecasts - telling you, for example, it’s going to snow for the next 6 hours. There is also an embeddable map from Windy which is updated live and has overlays for temperature, precipitation, barometry, CO concentration, etc.
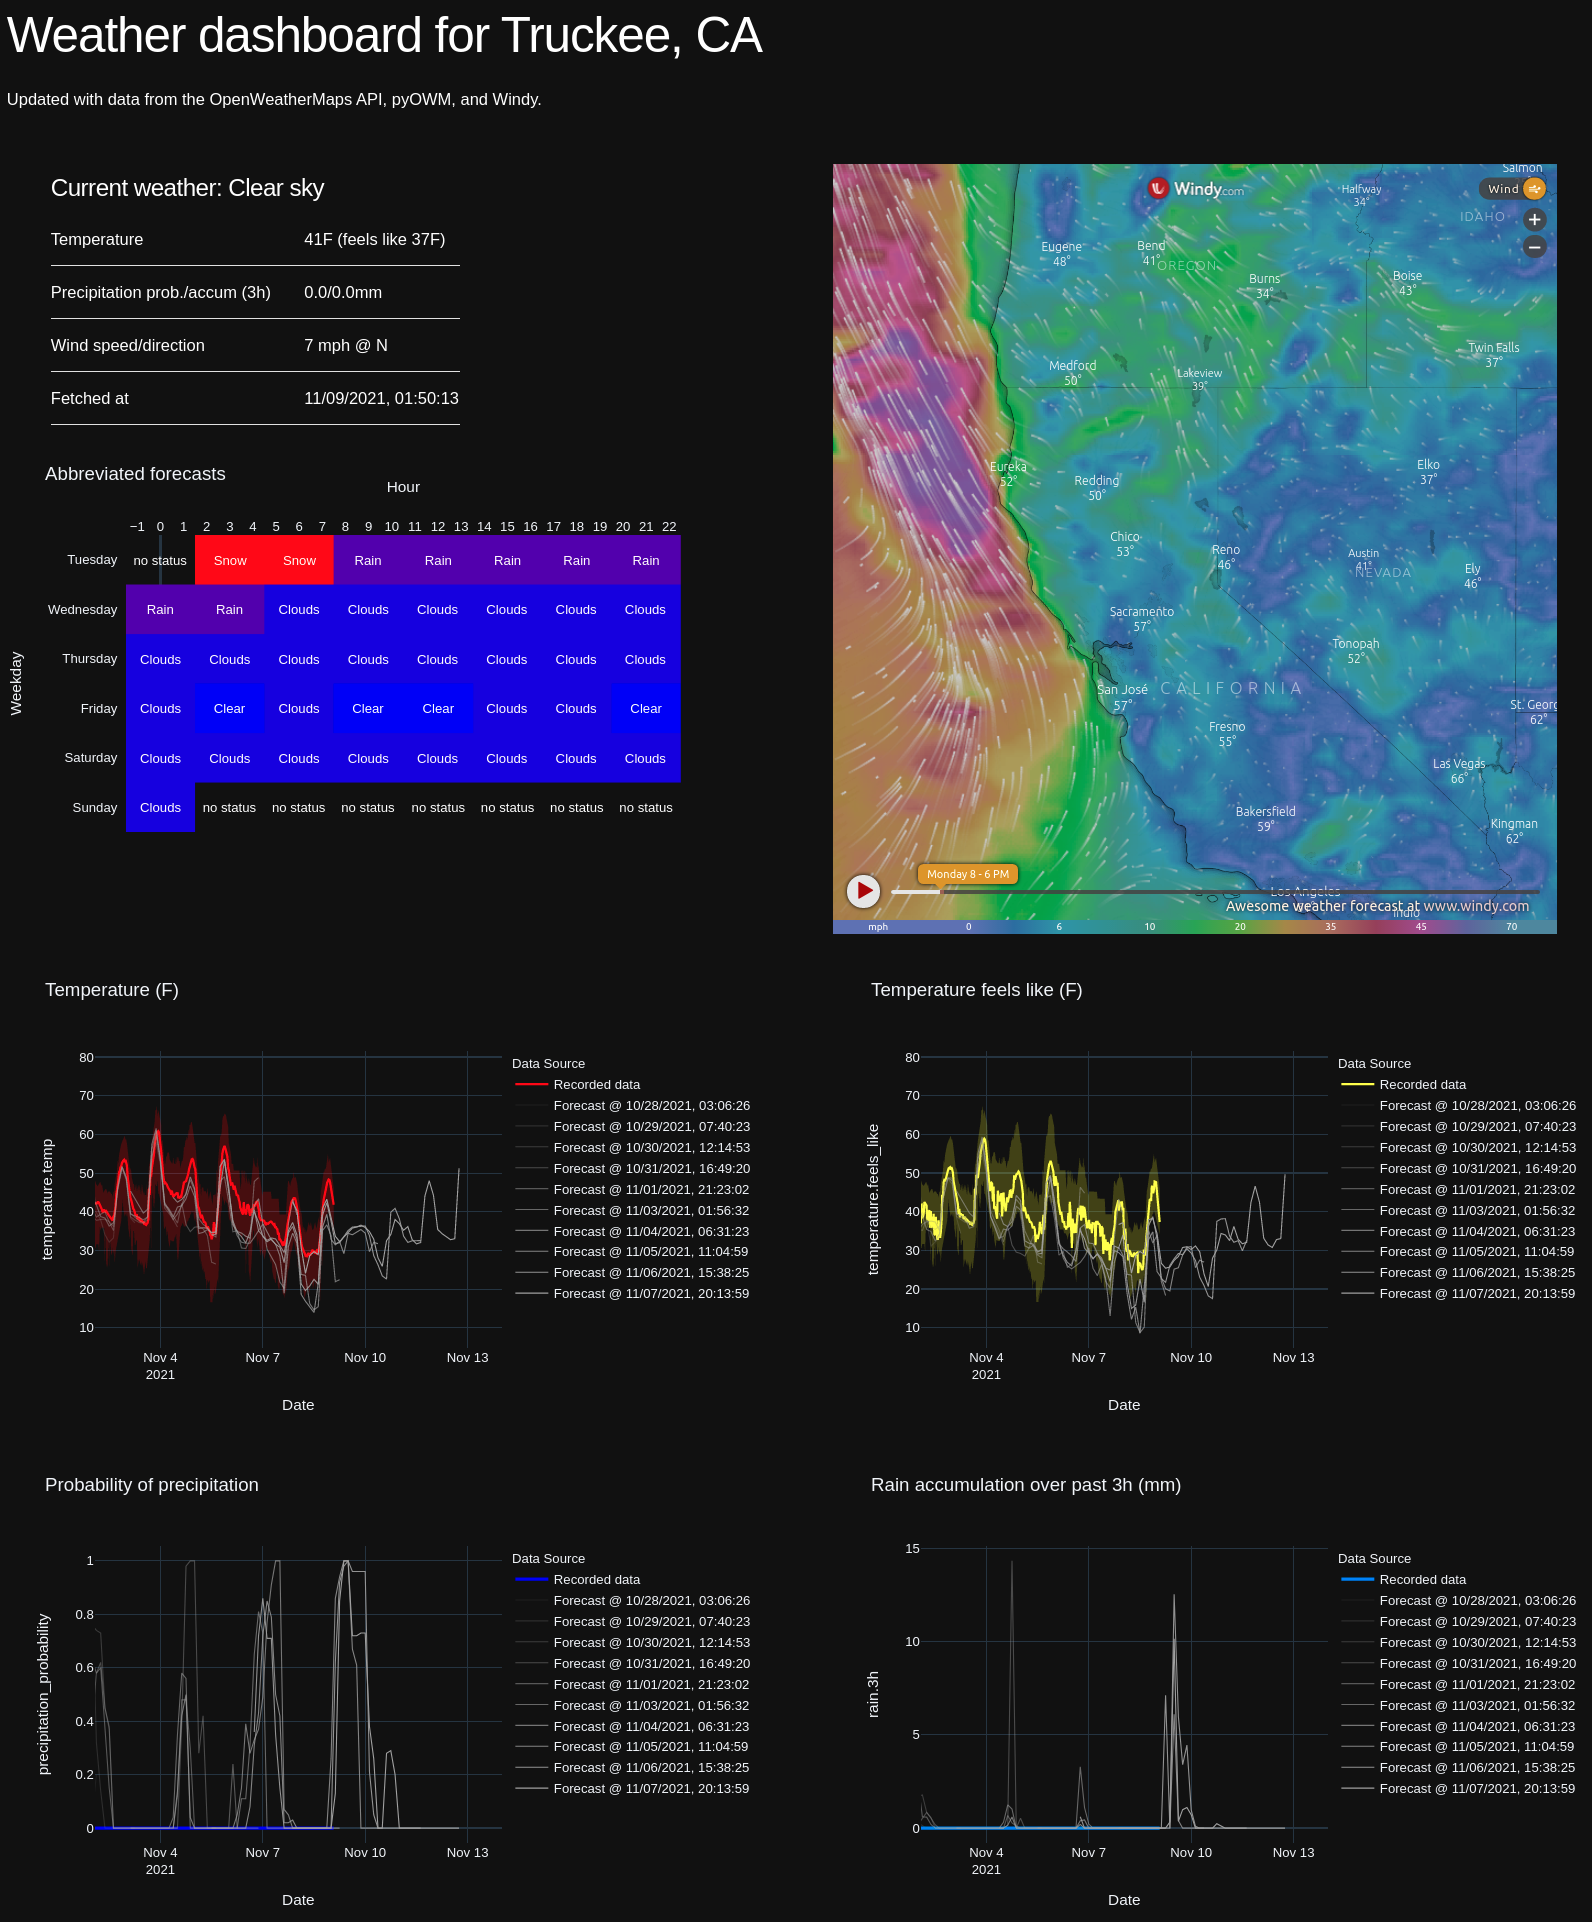
The rest of the dashboard is a bunch of interactive graphs formed from pulls to OpenWeatherMapsAPI, including forecasts predicted during different intervals. They usually show ~7 days worth of data.
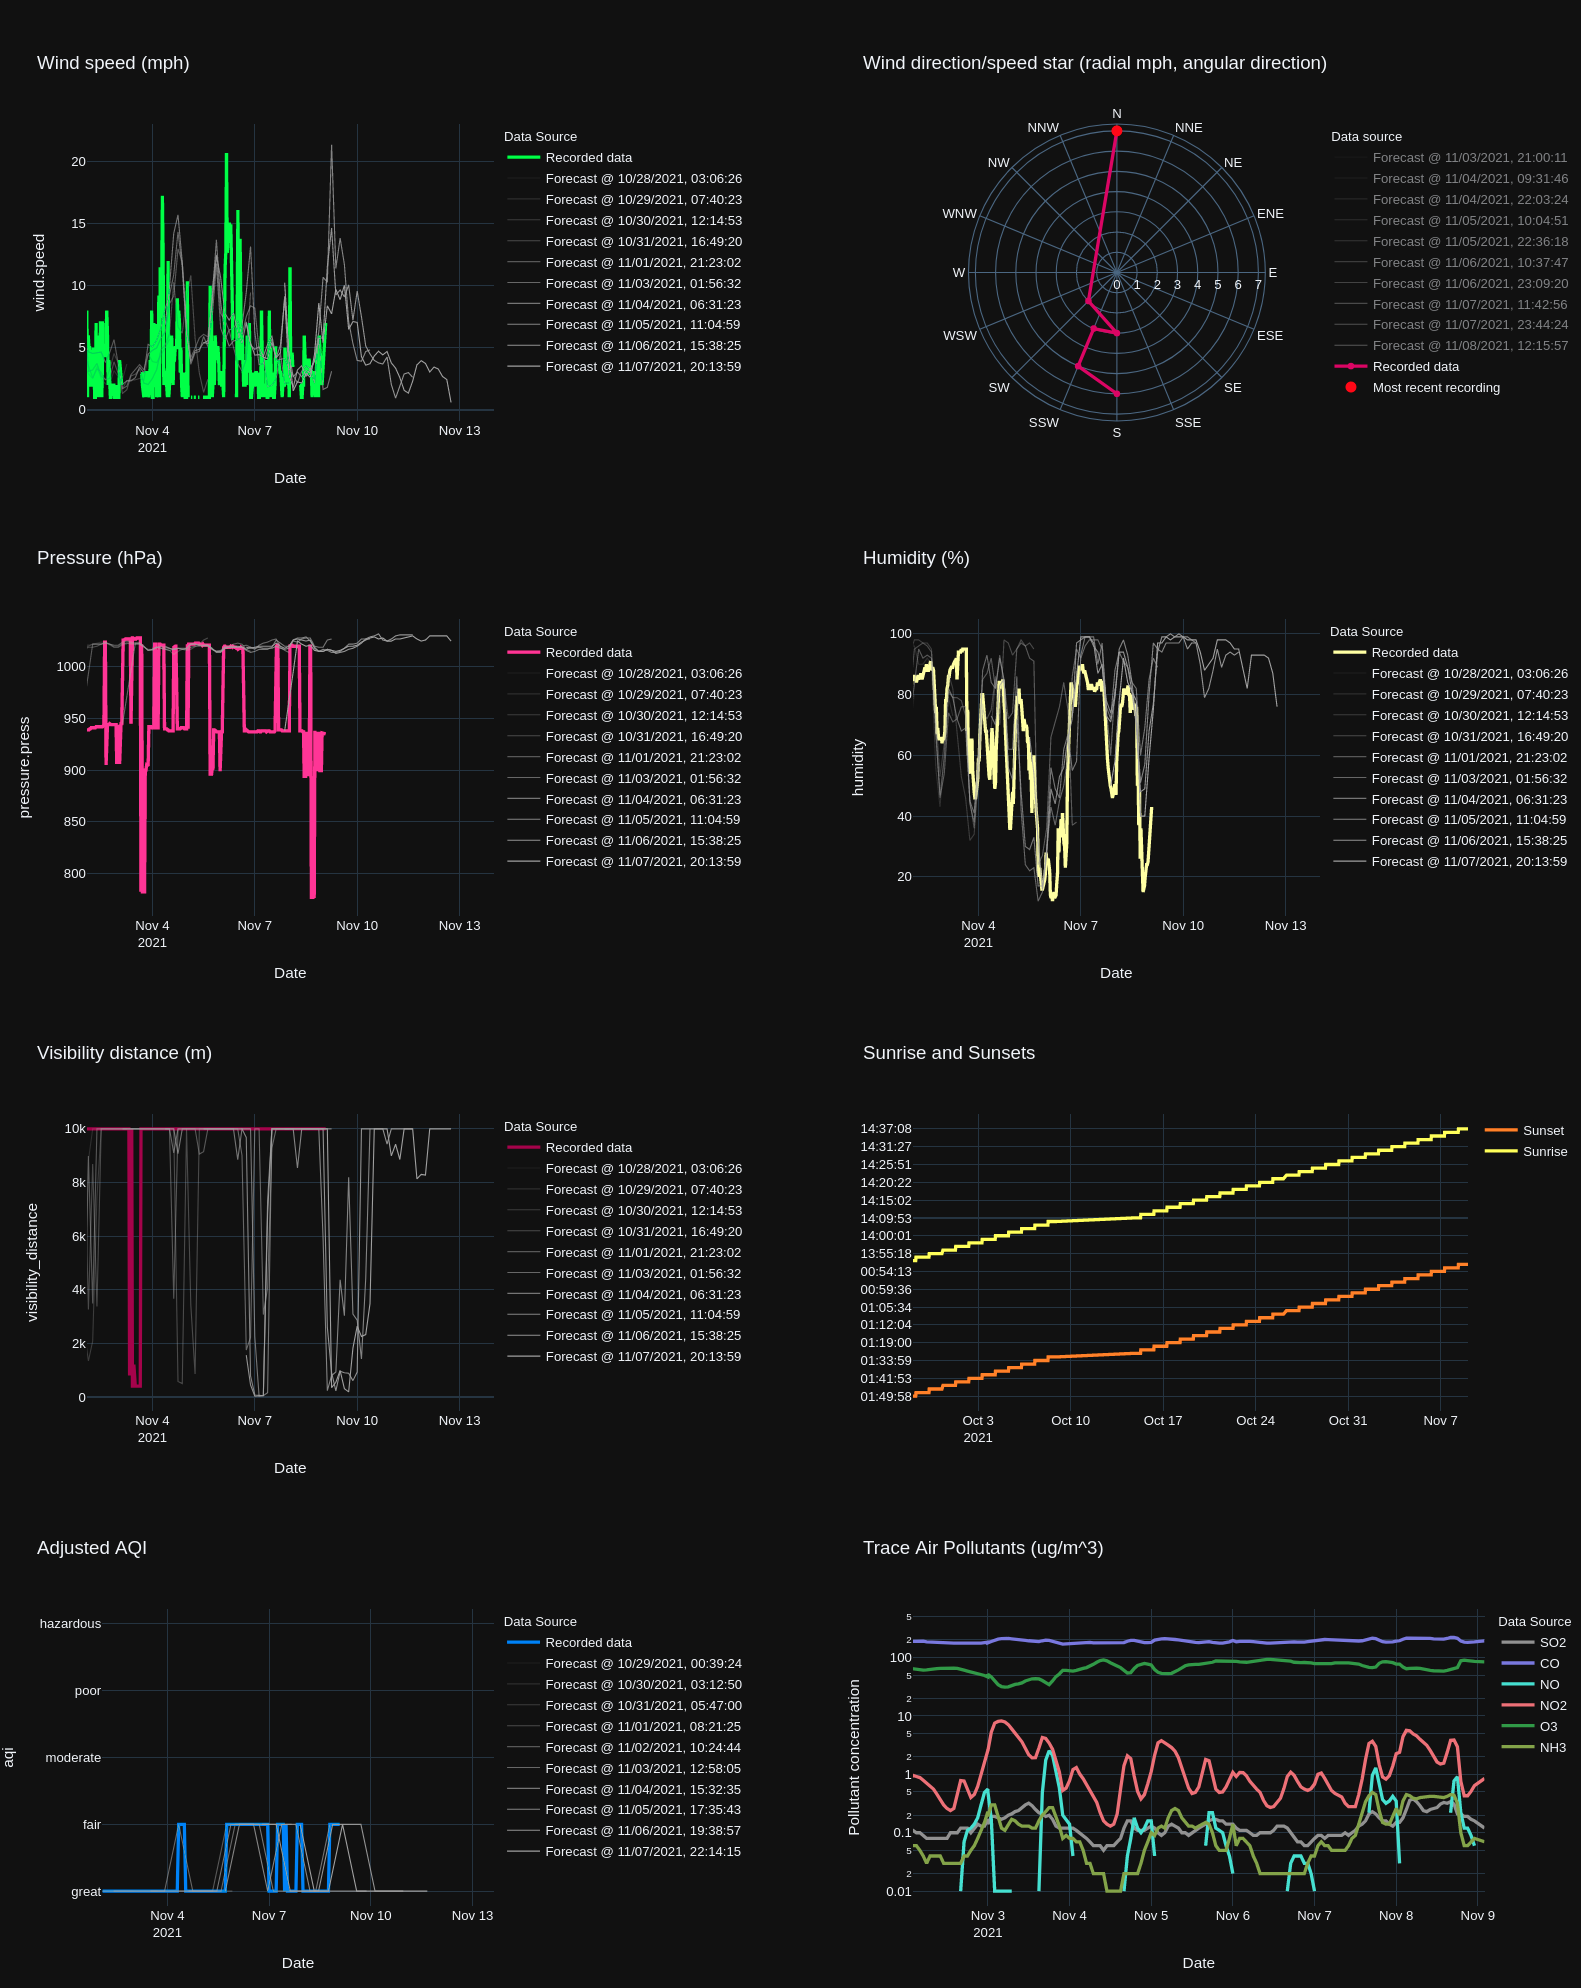 Coding the wind star from scratch was not fun.
There is some basic AQI-relevant data, such as the PM2.5 and concentrations of trace air pollutants in logscale.
At the very bottom, there are some “all-time” graphs of some limited metrics like temperature. These graphs show data collected over the entire time you’ve been running wdash. I accidentally deleted my database in early October, otherwise I’d have ~4 months more data to show :(
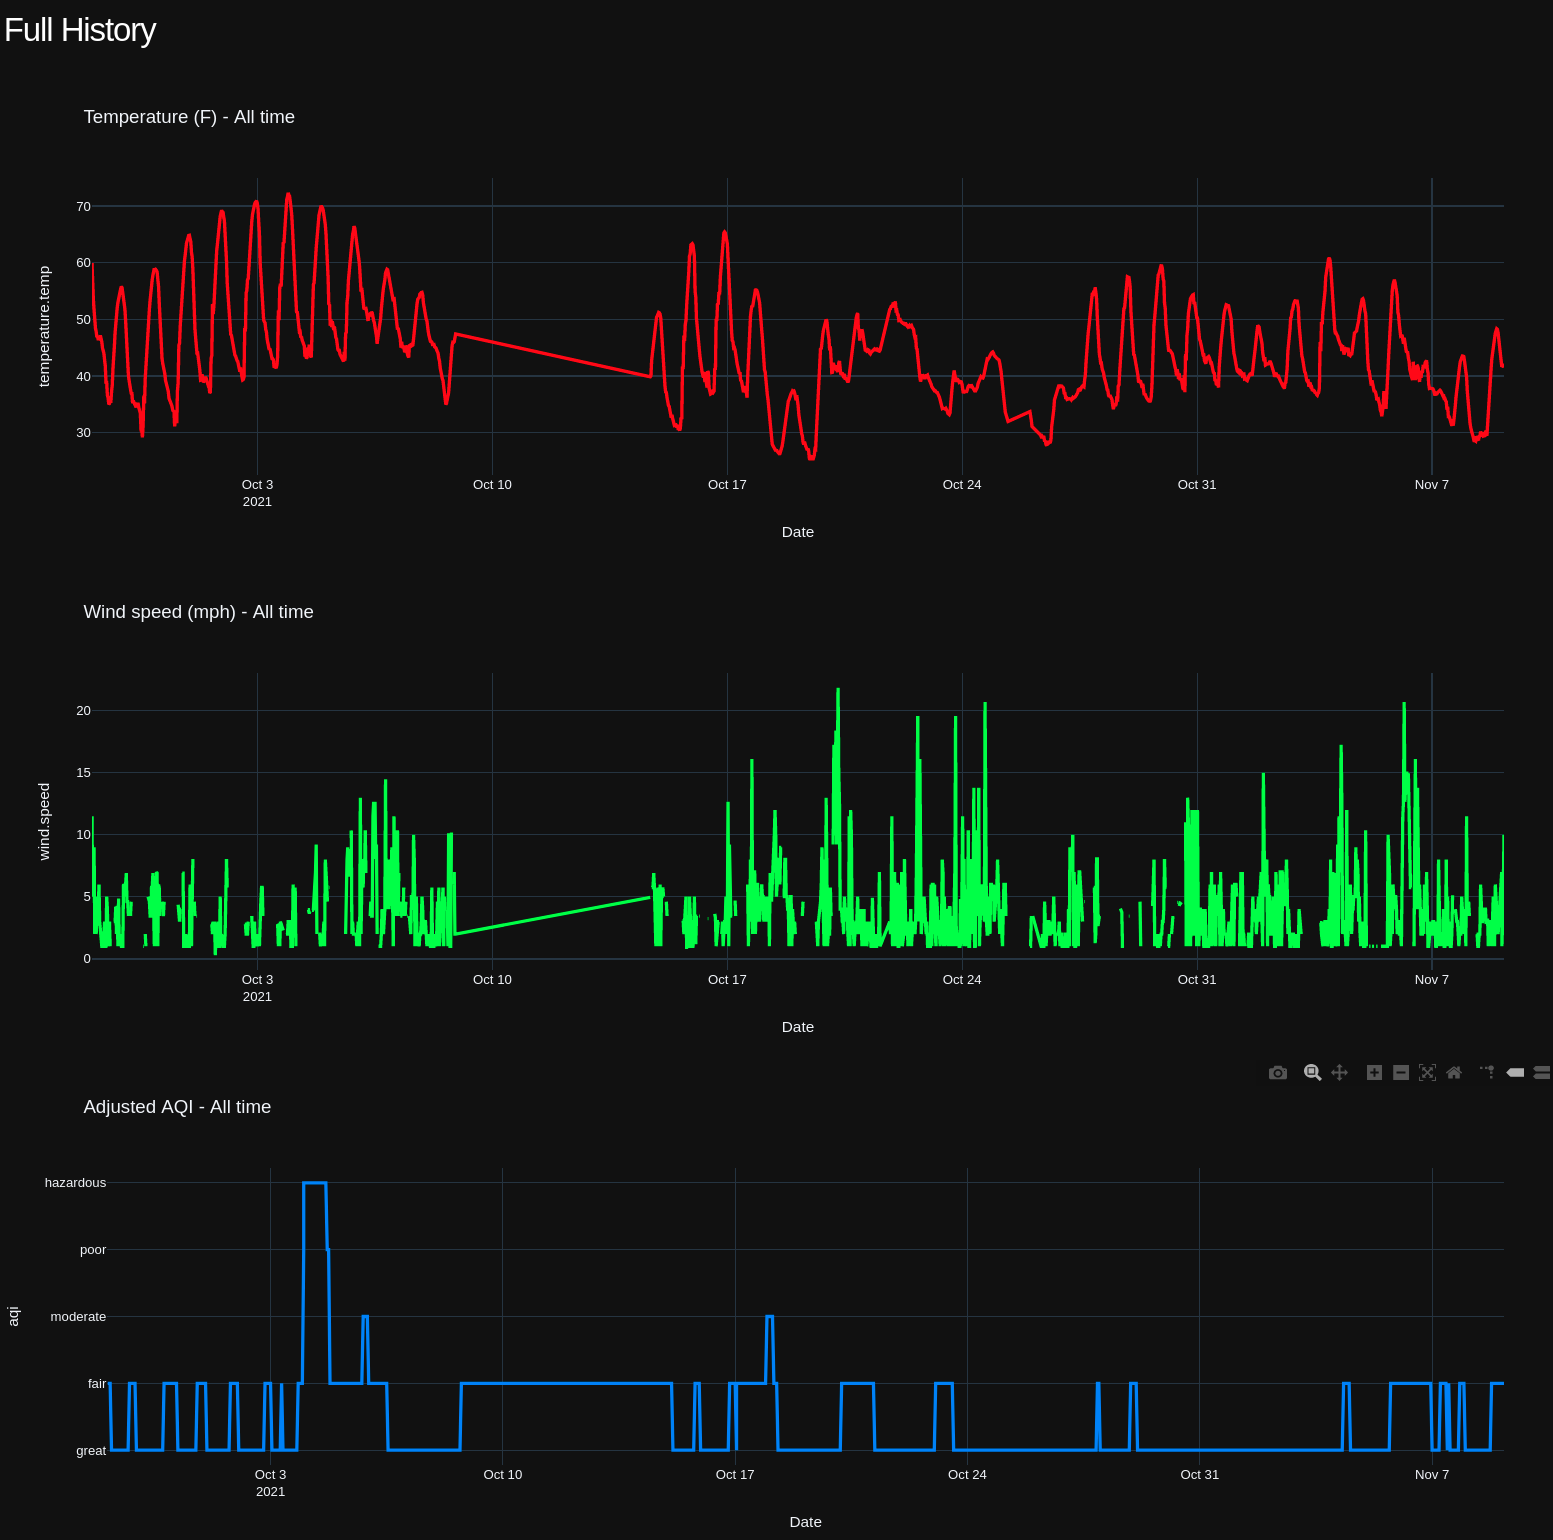 The flat sections that stick out were periods where wdash went down and didn’t collect data.
How it works
The dashboard is made of two parts:
- A data daemon which pulls data from OpenWeatherMapsAPI and stores it in a MongoDB (mine is local on my server).
- A plotly dash script which reads from this MongoDB and displays the graphs on the dashboard.
The data the daemon pulls is stored in your own database exactly as it is received from the server. This means if you run the server long enough, you’ll have your own free historical record of both forecasts and live weather conditions. At the moment, OpenWeatherMaps requires paid subscriptions for this kind of data.
Run your own
Find the code here.
There’s a single configuration file where you can enter in your latitude and longitude, as well as the port you’d like the application to run on.
LAT: 39.35559
LON: -120.22110

DB_HOST: localhost
DB_PORT: 27017
DB_NAME: "wdash"
INTERVAL: 1800
PORT: 57042
# Your api key goes here
API_KEY: ""
Once configured with an accessible MongoDB database, you should be able to run the dashboard with a single command.
$: source wdash/run.sh
You’ll probably want to run wdash on a server of some kind; the longer and more consistently it is run, the better and more complete your data will be. If you’re running a server on your LAN, accessing the dashboard will be as easy as pointing your browser to the server IP/port once both the daemon and the dash script are running.
It’s been updated a few times for stability but disclaimer! It’s basically just two hacky scripts. In my experience though it can go months without problems.