CalGradData: Interactive Visualization of Cal Graduate Financial Data
Recently the UC Berkeley Graduate Assembly put out a call for a Data Visualization contest of UC Berkeley’s graduate financial data. I think their motivation was to take the most boring data on the planet and transform it into an engaging and interesting form. Whether they succeeded or not, only time will tell.
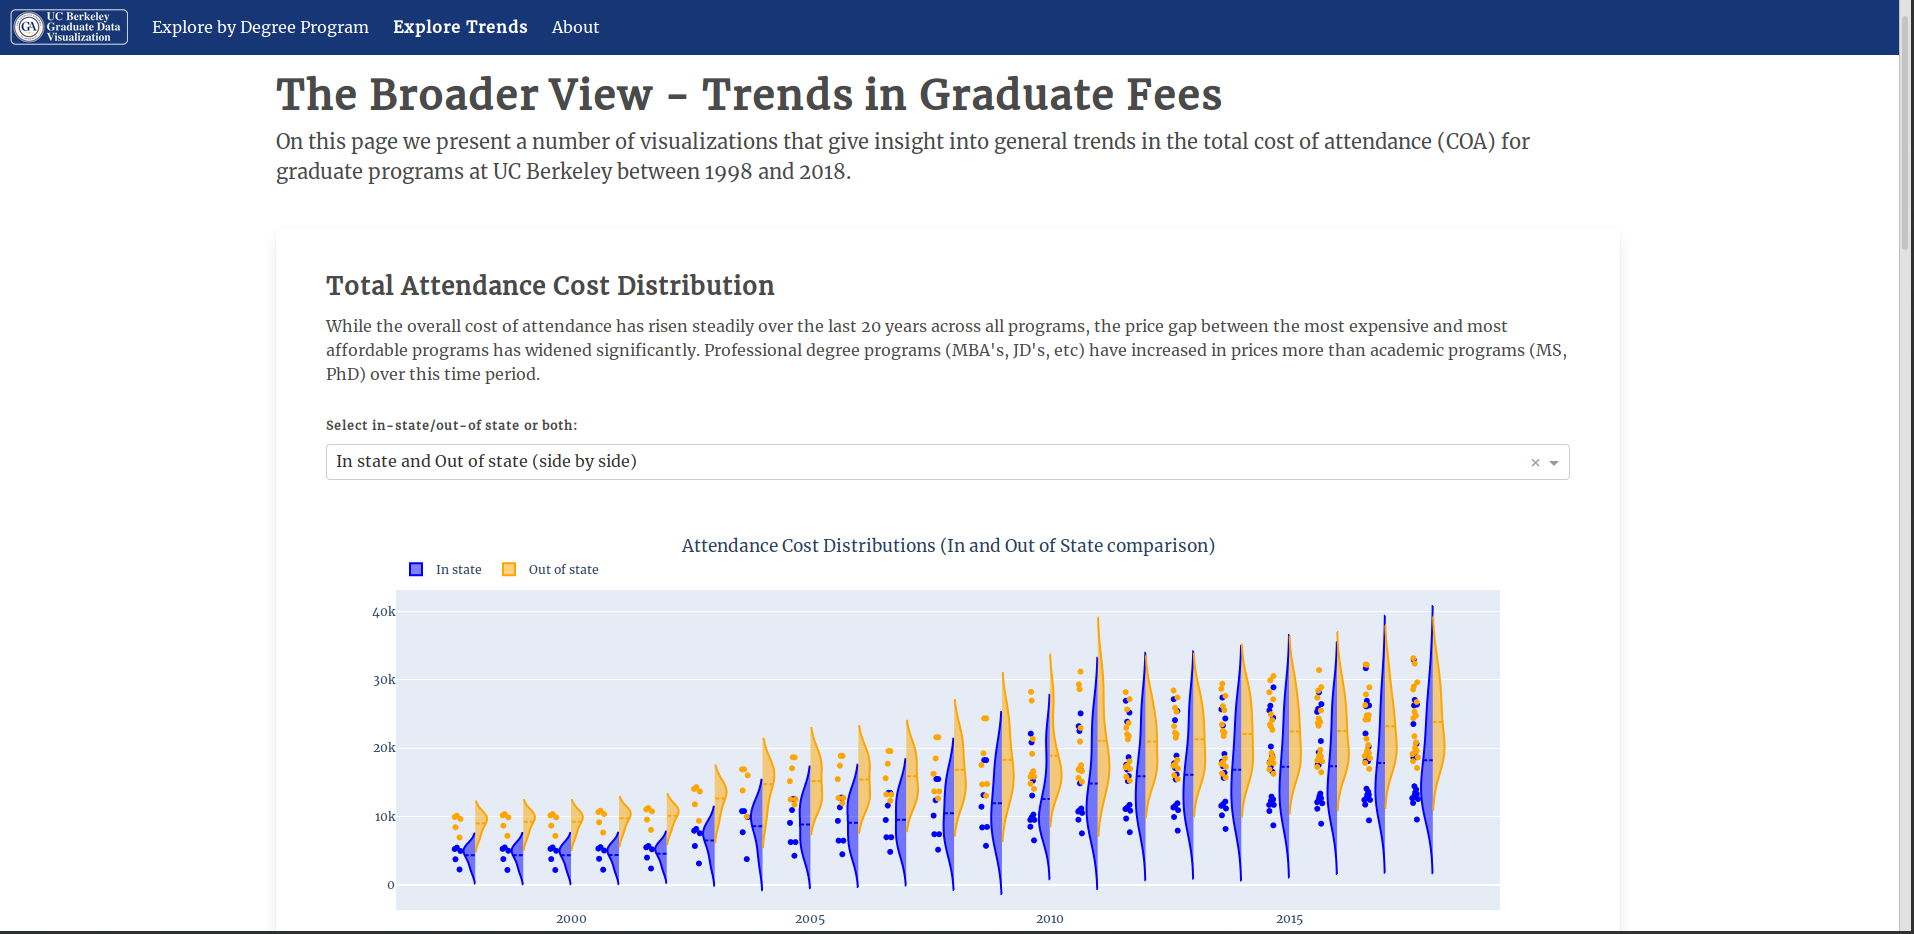
Well my friend (and fellow graduate student) John Dagdelen and I decided to put our HTML, CSS, JS, and Plotly Dash skills to use in making an interactive website for this otherwise bone dry data. The result is CalGradData, a website we built and deployed over the course of the week leading up to Halloween 2019. Check it out here:
calgraddata.herokuapp.com
A quick video of the website
If the link is down (i.e., if this is many years in the future), check out this quick video demo of the website:
Update (Decemeber 2, 2019):
We were selected as the overall (schoolwide) winner of the contest!

There will be some more info in the first December edition of the Delegates Digest. Both John and I were very excited (and $300 richer in prize money!).
Meta-visualization: The Coding Process
I thought it would be fun to also screen record my coding process as we built this app from scratch. At first I was certain it would only be a few hours of video…
How long could it take to make a little dashboard?, I thought it my naivete
But - as with all projects - it went beyond the expected schedule. So enjoy a 1000x speedup of ~30 hours of coding. For extra fun and stress, watch the clock on the upper righthand corner.
Includes:
- Setting up a virtual environment
- Data munging
- Creating the plotly dash app
- Debugging
- More data munging
- Making cool graphs in Plotly
- Dead air where I take a break at Chipotle
- More debugging
- More debugging (x100)…
Epilepsy warning: Bright, flashing colors.
You can check out our hacky, disgusting code on Github (if you’re into that sort of thing).