Finding new roommates can be a serious pain.
Both of my housemates moved onto bigger and better things in July, so the unfortunate responsibility to find replacements fell upon me. 99% of the time, I’d call upon a friend to fill a spot, but our house is a bit out in the sticks – far away from the happening SF Bay tech hubs and city centers, and nobody I knew in the area was looking to change their living arrangement.
So I turned to the trusty backwater of the internet. Craigslist.
TOC
The Screening Process
Craigslist is a reliable tool, insofar that it’s guaranteed to give you a large population of replies. But here’s a simple fact about Craigslist: it’s filled with scammers, criminals, and otherwise shady people who you’d rather not live with. So my landlord and I devised a screening procedure to hopefully weed out the slobs, petty criminals, bots, and serial killers of the interweb.
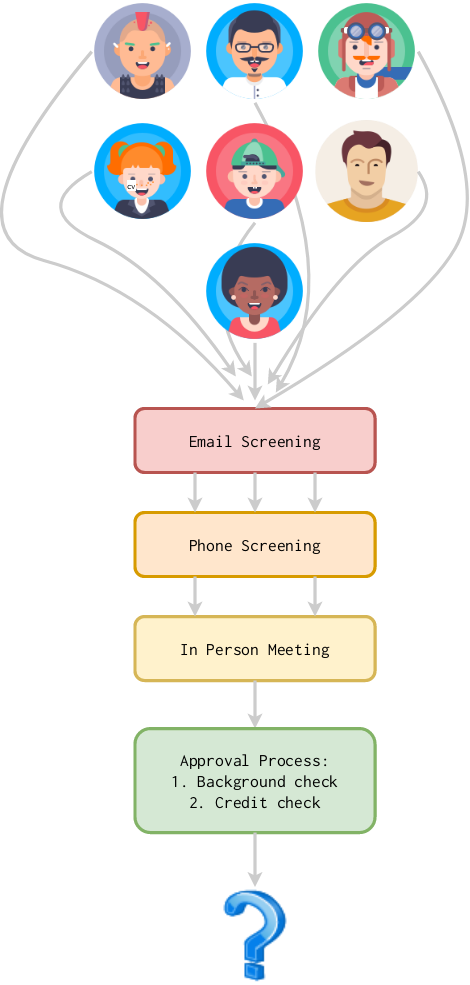
First comes a short conversation over email, straight from the ad. Then, a short phone interview. If that all goes well, we invite them over to the house (we’d hope to screen out any sketchy people by this point). If they like the house and we like them, they move onto our landlord’s approval process. Then, they’re our new roommate!
Results
Below is a Sankey Diagram (made with SankeyMatic) of the whole process over the last two months. In total, almost 100 responses screened!
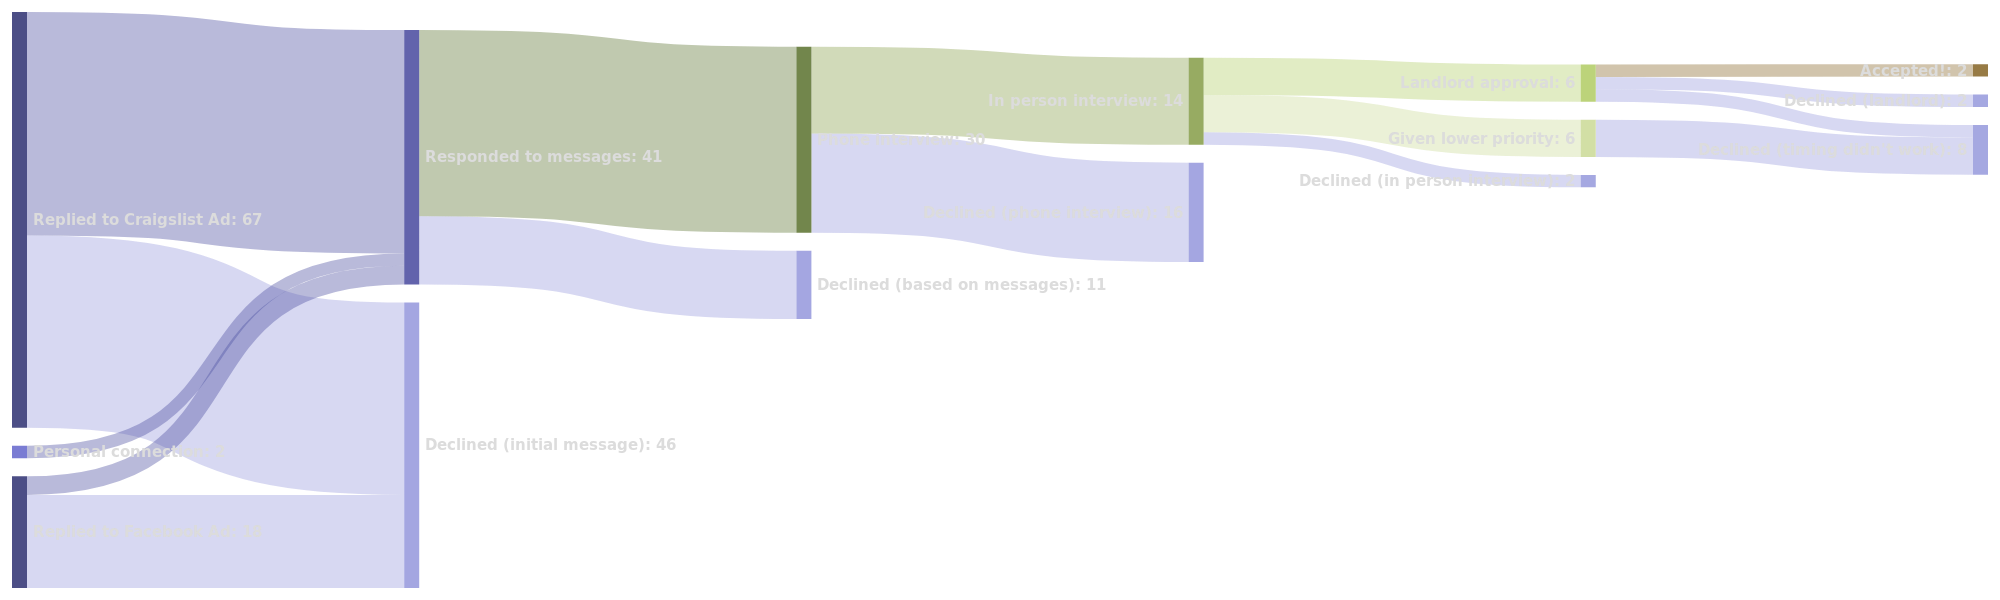
Hint: Hover over the picture to zoom!
In the end, one of our roommates wound up being a craigslister and the other was from a personal connection.
Breaking down the stats, final “acceptance rate” for all candidates is 2⁄87, or 2.29%. If we limit that to Craigslist inquiries only, it’s 1⁄67, or 1.49% – even lower! That’s lower than Stanford, Harvard, Yale, MIT, Princeton, and Caltech. So you might say getting into our house is harder than getting into the best universities in the world. :)
If you did say that though, the analyst in me would tell you to hold up! This is a textbook sampling problem, our $ n $ is <100 in both cases! The college admissions statistics, in contrast, are taken frrom hundreds of thousands of data points. If we had only interviewed half the candidates and accepted none, would our true acceptance rate be 0%? Of course not. We have data on a sample of a population, not comprehensive data of the population itself. So how can we determine whether our screening process is more selective than the world’s top universities?
We need to bust out our AP Stats handbook and use statistics to answer this pressing and important question.
A statistical test…
Let’s get a measure of probability for whether our house acceptance rate is in fact smaller than say, Stanford’s acceptance rate of 5.1% (admission year 2019). First, we must form a proper null hypothesis. We will formulate our null hypothesis such that rejecting it indicates our acceptance rate is less than Stanford’s. If we fail to reject the null hypothesis, there is insufficient statistical evidence.
Here we’ll use the notation $ p_{\text{Stanford}} $ to represent the Stanford acceptance probability. This number is treated as a population statistic. Our overall acceptance probability is $ p_{\text{roommate}} $, and it’s point estimate is what we previously calculated from our sample: $ p_{\text{roommate}} = 0.0229 $. We’ll call the total number of candidates we interviewed $ n_{\text{candidates}} = 87 $, or $ n $.
Our hypothesis test is:
We’ll choose a significance level of $ \alpha = 0.05 $; our hypotheses are written as one-tailed tests, and our null distribution is defined for $ p_{\text{roommate}} = p_{\text{Stanford}} $ Now, all we need is a test statistic of some kind!
In particular, we need a statistic for whether the proportion of one variable with two outcomes is different from the expected proportion; in our case, the outcomes are whether a candidate becomes a roommate or not, and our “expected proportion” is $ p_{\text{Stanford}} = 0.051$. The two usual tests for this scenario are:
Pearson’s $ \chi^{2} $ one-variable test:
A very popular test based on a $ \chi^{2} $-distribution (an approximation of a normal distribution). This test holds as long as the following hold:
- The sampling is random (i.e., each population individual has an equal chance of being selected for the sample)
- The observations are independent (e.g., Observation 52 does not depend on Observation 51)
- The expected frequencies of each outcome are greater than 1 and mostly greater than 5. Expected freqency is just the expected probability multiplied by the sample size. The exact cutoff for “mostly” varies by who you ask, but 80% is commonly used.
Binomial test
An exact test, meaning it is not based on approximate distributions or parametric assumptions. This test holds as long as:
- The sampling is random
- The observations are independent.
Applying the binomial test
The $ \chi^{2} $ test will not work here since while 1 and 2 hold, our expected frequency for being a roommate is $ p_{\text{Stanford}} \cdot n_{\text{candidates}} = 0.102$, and we need all of our expected frequencies to be greater than 1. We’ll use the binomial test statistic based on the probability mass functioni (PMF), defined as:
Where $ n $ is the number of samples, $ k $ is the number of “successes” (actually being a roommate, in our case), $ C(n, k)$ is the formula for the number of combinations for $ k$ selections from $ n$ objects, and $ p $ is just our population probability, $ p_{\text{Stanford}} $. $ P$ is the probability of randomly observing a sample statistic as or more extreme than this sample, assuming the null hypothesis is true. In other words, if this probability is high, it’s likely out sample was just a fluke and the null hypothesis is true. If you’re wondering where this equation comes from, I’ll refer you to this excellent derivation which requires no math background and is written in plain language (for the non-math savvy amongst us).
Let’s set some variables from what we know:
$ k = 2$: The number of “successes” (roommates) we observed.$ n = 87$: The number of total applicants$ p = p_{\text{Stanford}} = 0.051$: The probability we are testing against.
It might be tempting to plug the numbers right into our PMF, but we actually need to calculate the probability that we have surprisingly few successes (not $ k =2$ successes exactly!) because we are trying to answer $ H_{a}: p_{\text{roommate}} < p_{\text{Stanford}} $.
What we really need is the cumulative probability mass distribution function for the lower tail, which is:
In continuous probability distributions, we could take the integral of $ P(X) $ - but since we are dealing with a discrete binomial distribution, we need to sum over the probability mass function.
In other words, the probability of fewer or equal to $ k$ successes is equal to the probability that there are either 0, 1, or 2 successes.
Now we’ll use trusty python scipy to calculate:
from scipy.stats import binom
n = 86
p = 0.051
sum = 0
for k in [0, 1, 2]:
    binomial = binom.pmf(k, n, p)
    print(f"{k}, {binomial}")
    sum += binomial
print(sum)
After running:
$ k $ |
$ P(x = k) $ |
|---|---|
| 0 | 0.011 |
| 1 | 0.051 |
| 2 | 0.117 |
| 0-2 | 0.179 |
Let’s plot the PMF to better visualize our distribution;
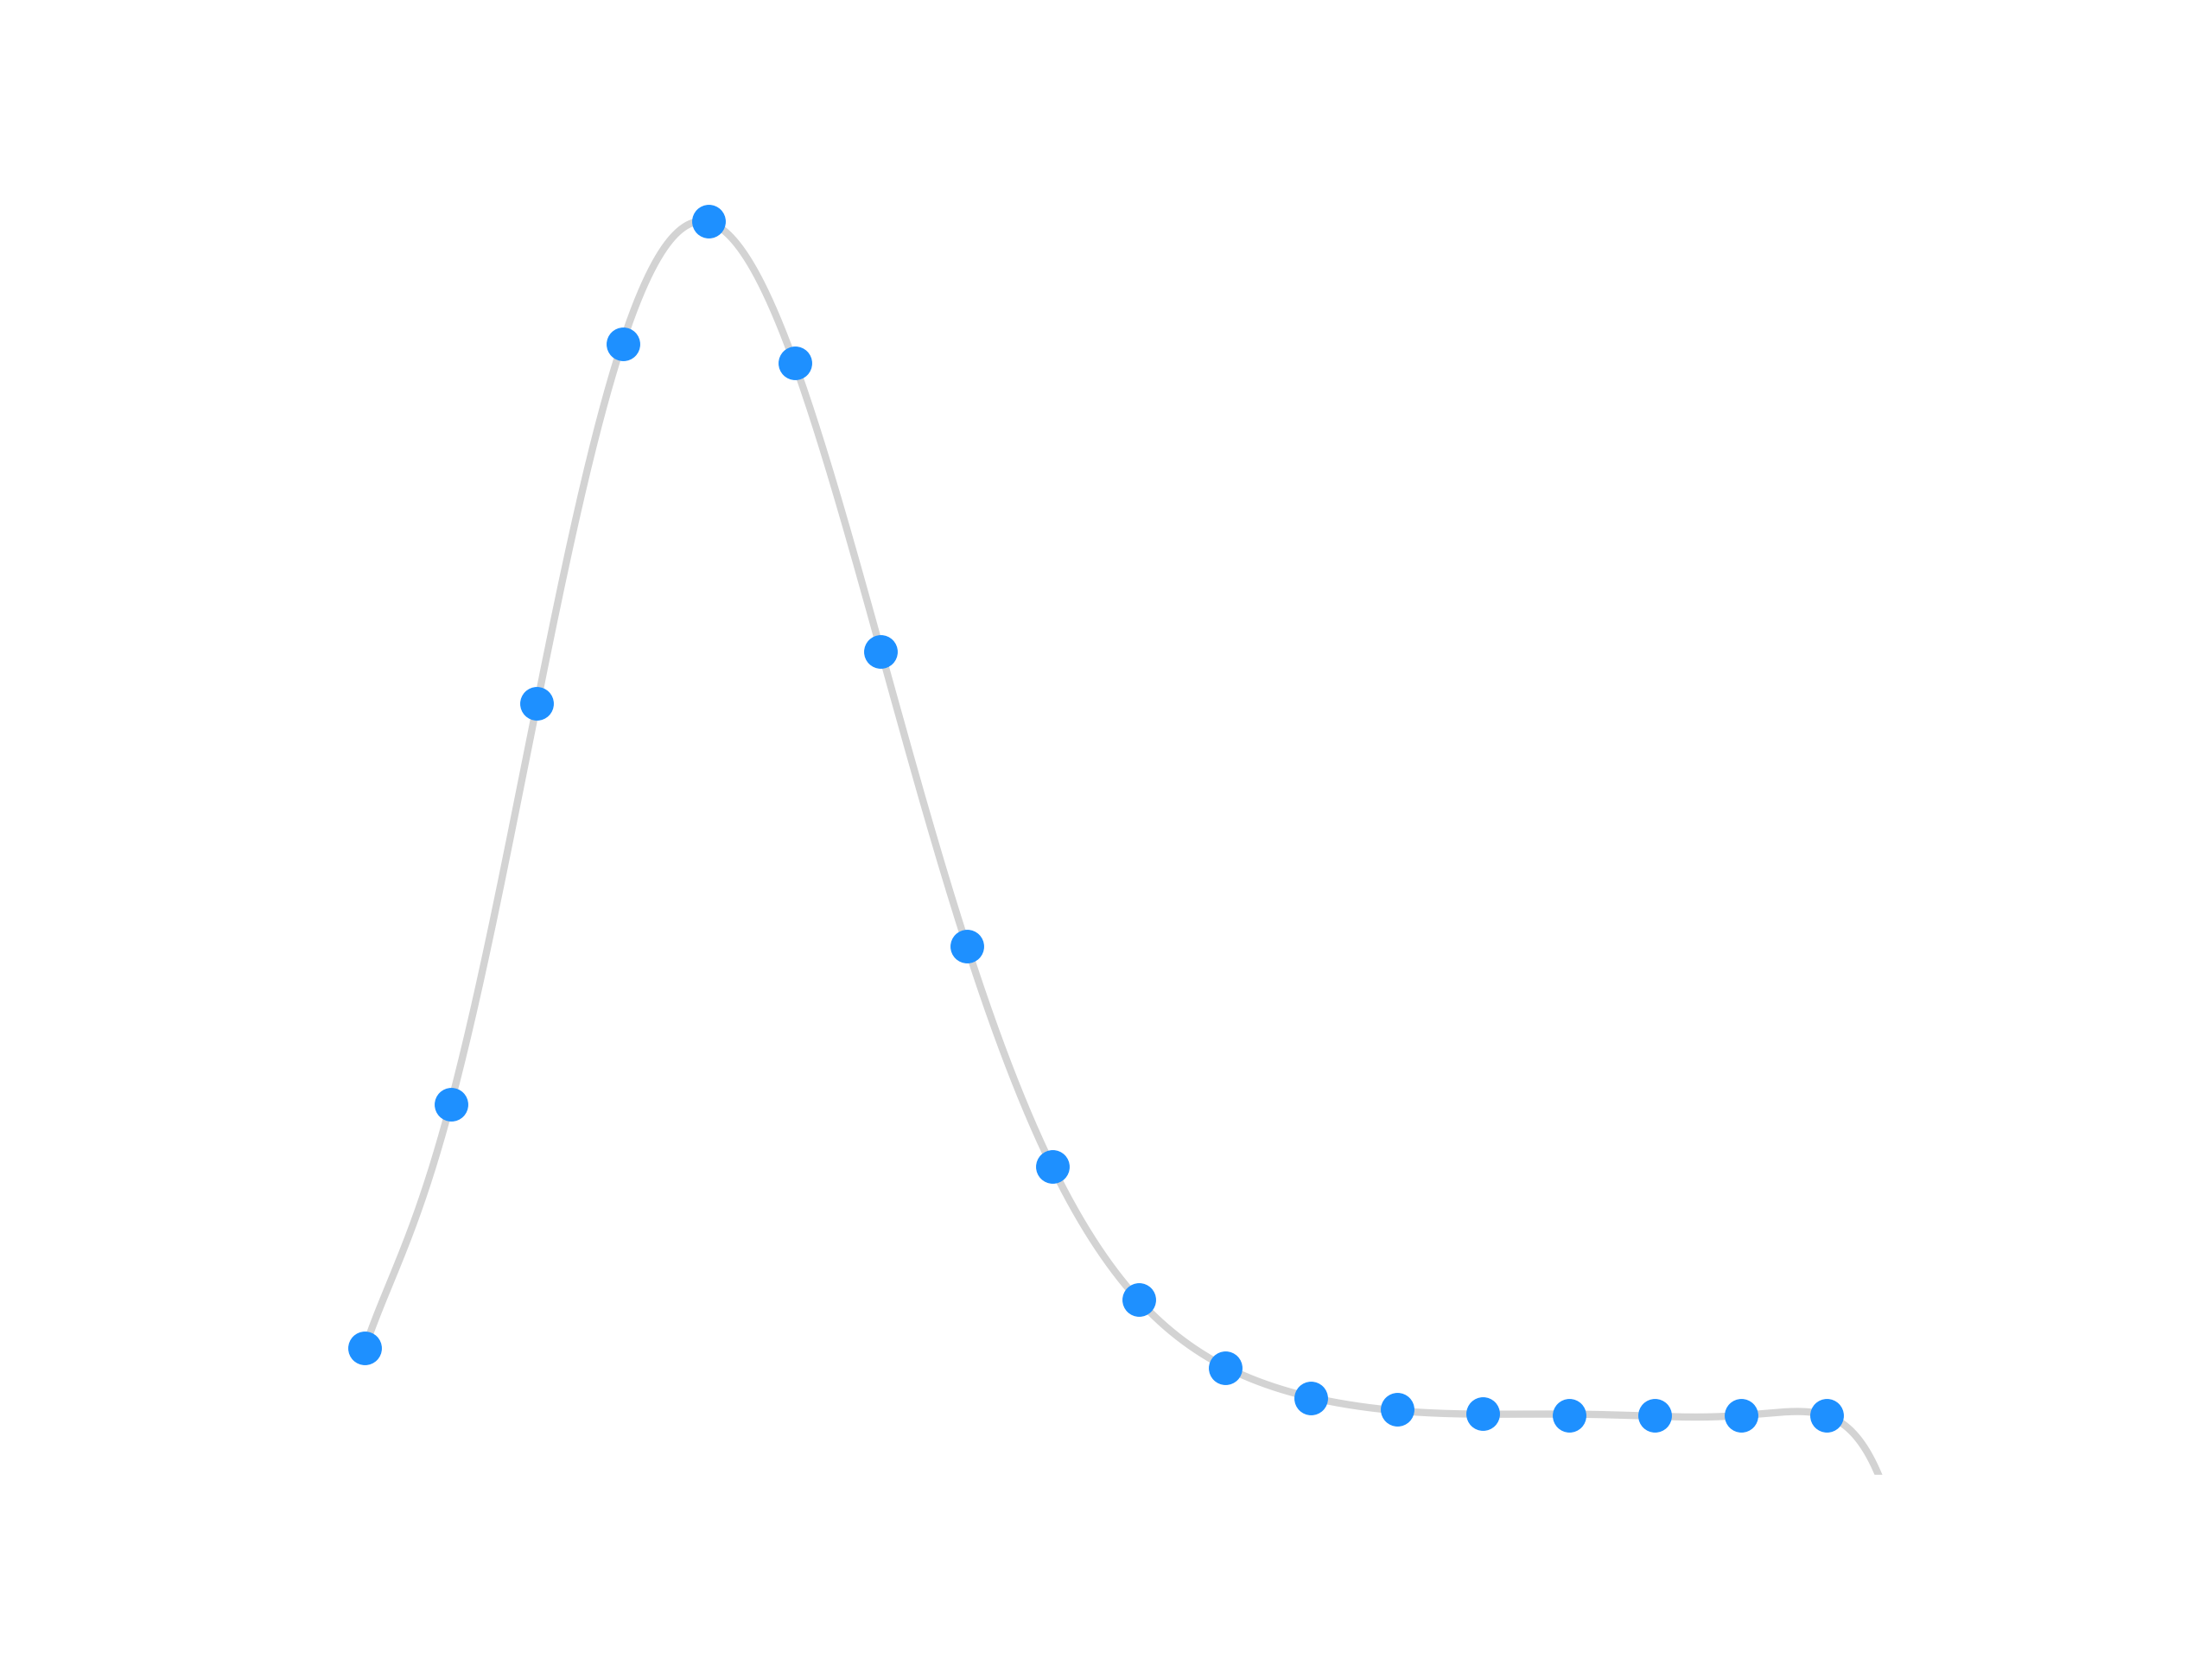
Finally, we find $ \boxed{ P(X \leq 2) = 0.179394} $, more than our $ \alpha =0.05 $ significance level. This is great news for our null hypothesis, because it means we fail to reject it! Conversely, it’s some pretty terrible news for our alternate hypothesis. Simply, this means there is a high probability our low roommate accpetance rate was a fluke.
We don’t have sufficient evidence that our roommate selection process is more selective than Stanford (at the 5% significance level).
If you would have jumped to conclusions, you might have sullied the name of the great Stanford university!
What if I told you…
Now that I’ve made the arduous case that we can’t jump to conclusions in saying our roommate selection process is more competitive than top-tier universities…
What if I told you..
Our statistical test was bunk!
While I feel the above is a pretty convincing case, let’s consider a few practical problems:
Population statistic - Craigslisters are different from Stanford applicants. I think we can all agree your average Ivy-League applicant has their life pretty well put together; they’re high achievers in high school, likely have financially stable parents (guarantors), and can pass a background check. Craigslisters and Facebook randos on the other hand are … who-knows-what. These two groups are fundamentally different populations, one with likely a much higher intrinsic ability to pass a housing screening. How would our numbers change if all the interviewees were typical Stanford applicants? Or consider the inverse: what if all Stanford applicants were drawn from the same general population as our interviewees? i’d wager the Stanford applicants would increase our screening acceptance rate, and that less than 5% of our interviewees would be accepted to Stanford. So then, is it really fair to take
$ p_{\text{Stanford}} $for comparison with$ p_{\text{roommate}} $?.Indepedent observations - Real life observations are not necessarily independent. My interviews certainly were not. Depending on how many quality applicants I had “in reserve”, I put in more or less effort in recruiting new applicants. Moreover, the more applicants I interviewed, the more annoyed towards the process I became, making the acceptance of later candidates less likely. Thus, the sampling (interviewing) of one candidate affected the outcome of many of those that came after him/her. This violates one of the core assumptions of the binomial test. Additionally (although it is splitting hairs a bit), the exact binomial test is for experiments with replacement - in screening roommates, candidates who have already been rejected have no chance to reapply. So although the population is rather large, and ignoring that not replacing indviduals after sampling does not change the outcome much, it is still worth noting that the binomial test is approximate in this case - Fisher’s exact test would be more fitting, perhaps.
Hidden variables - While not directly invalidating our statistical test, there are some hidden variables which might convolute the roommate acceptance rate. Timing is certainly a hidden variable; for example, I put in more effort in recruiting applicants the closer I got to the end of our lease. Even my daily mood on any given day influenced how I percieved certain applicants - I apologize to everyone who caught me on Monday morning. The point is, we have hidden variables which can shift the distribution.
The numbers tell us something, but that something is not necessarily what we concluded in the previous section. Getting an accurate answer requires a much more complex and thorough analysis. Throwing around statistics willy-nilly will lead you to conclusions which may not be true but which people will believe because numbers stand behind them - erroneous as they may be. The end result is you (the data scientist) or the company you work for making poor strategic decisions. Cue one of the all-too-common “our model worked well in testing, why isn’t it working in deployment” stories.
As data science and machine learning come further into the mainstream, it’s imperative we try our damndest to set up problems correctly and use our models to approximate reality, rather than bend reality to make our models work.